Portfolio
Data visualization for scientific experiments
About the project
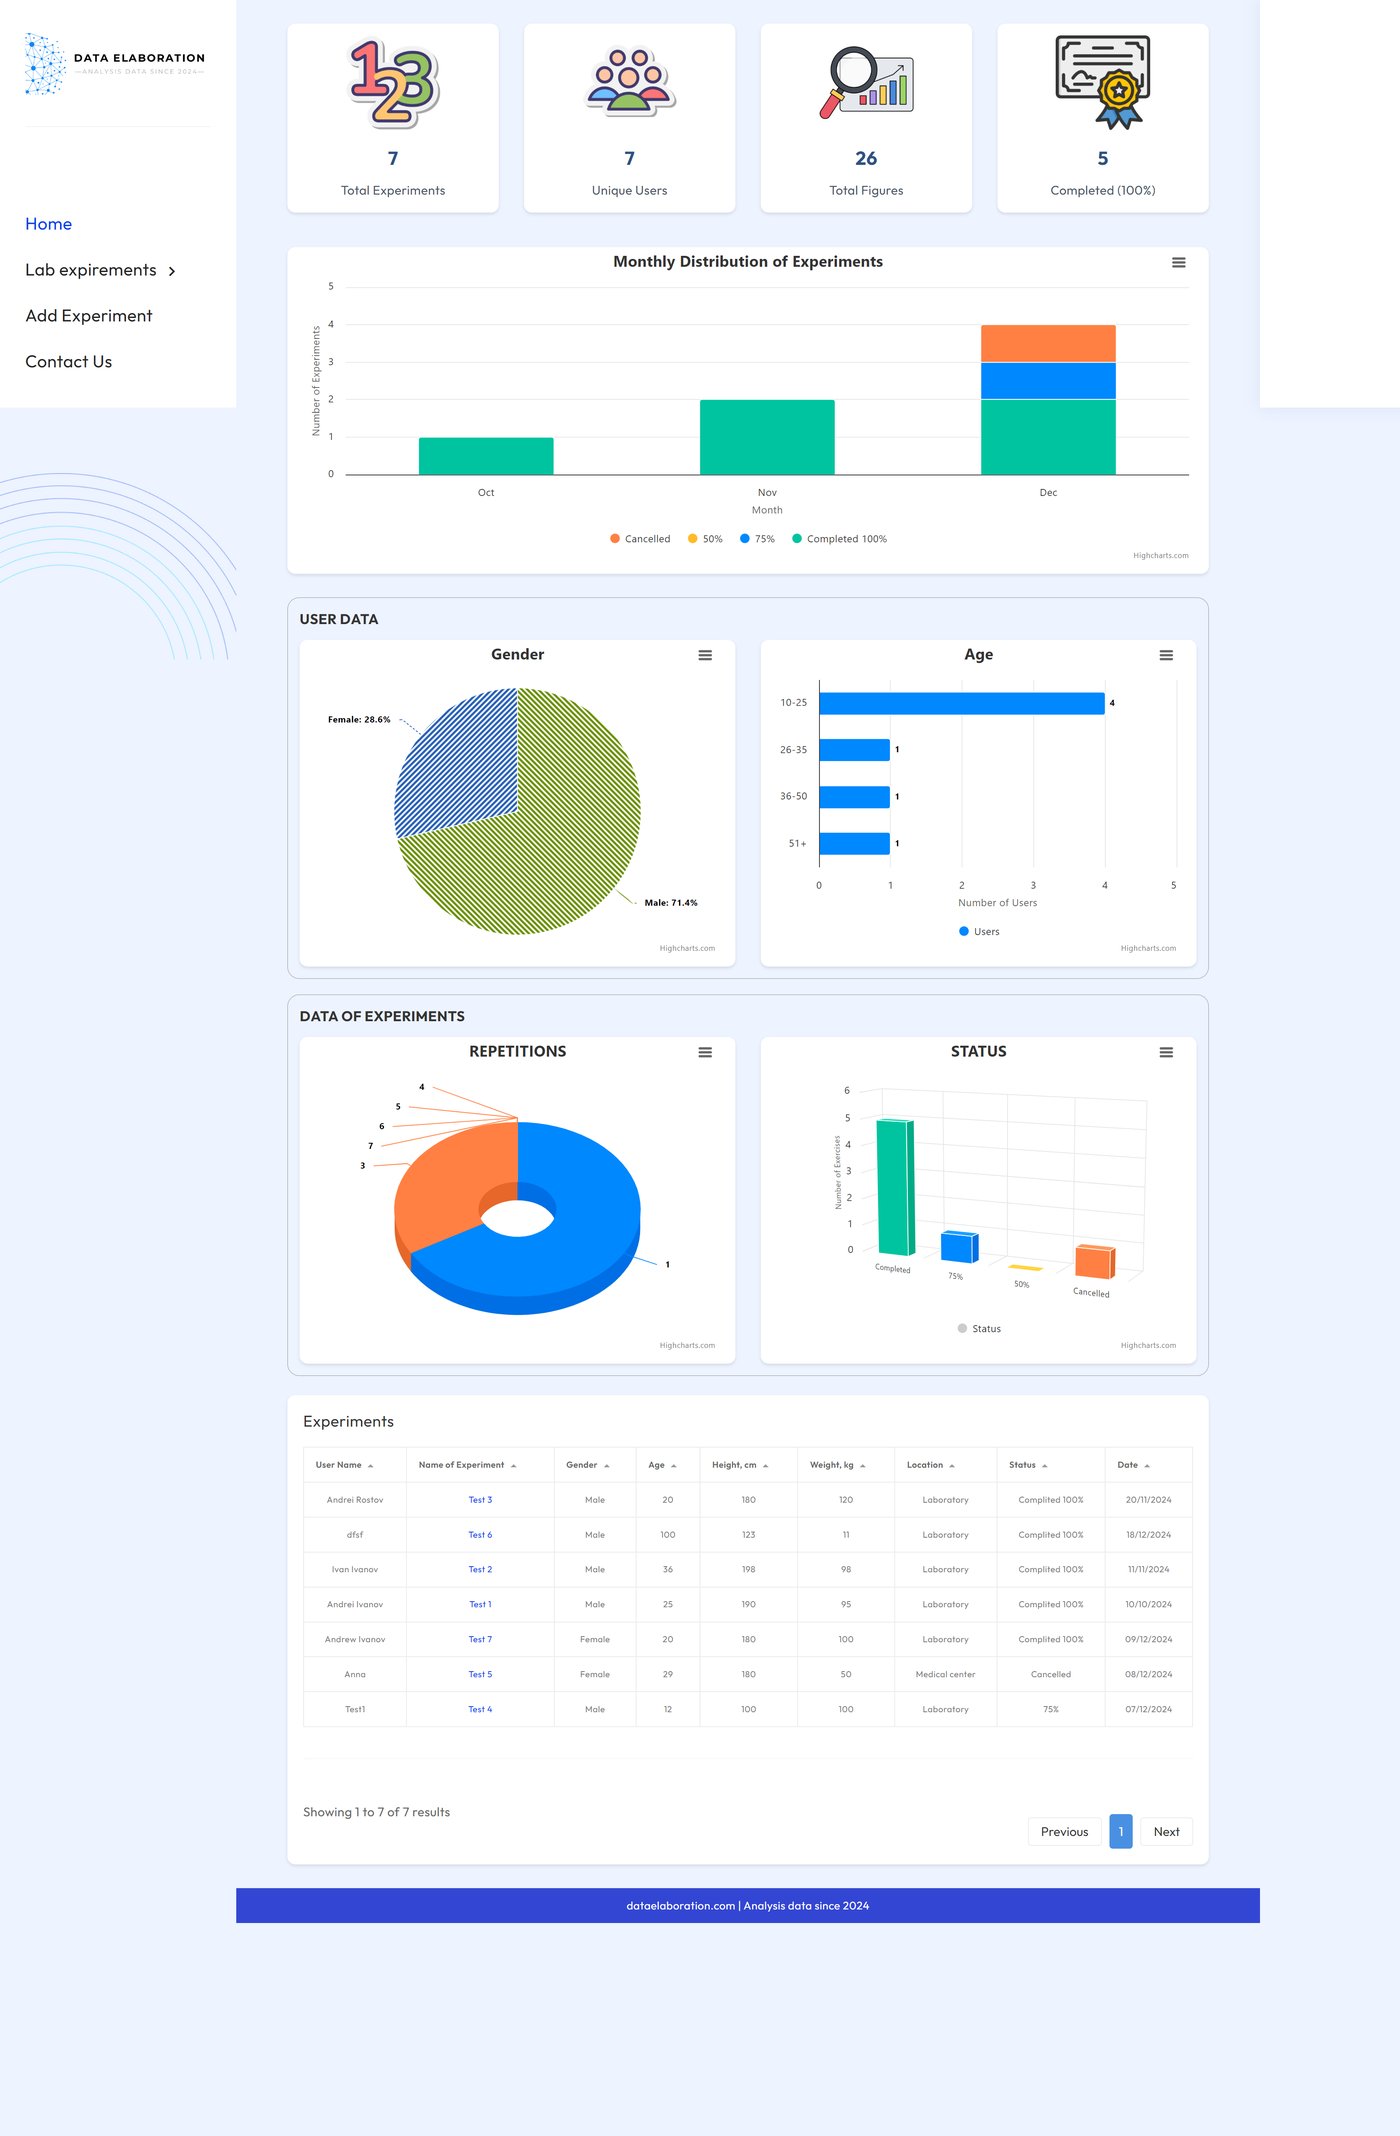
An interactive platform for visualizing and analyzing scientific experiment data. The project was built for researchers who need a tool to present complex data visually and interact with it.
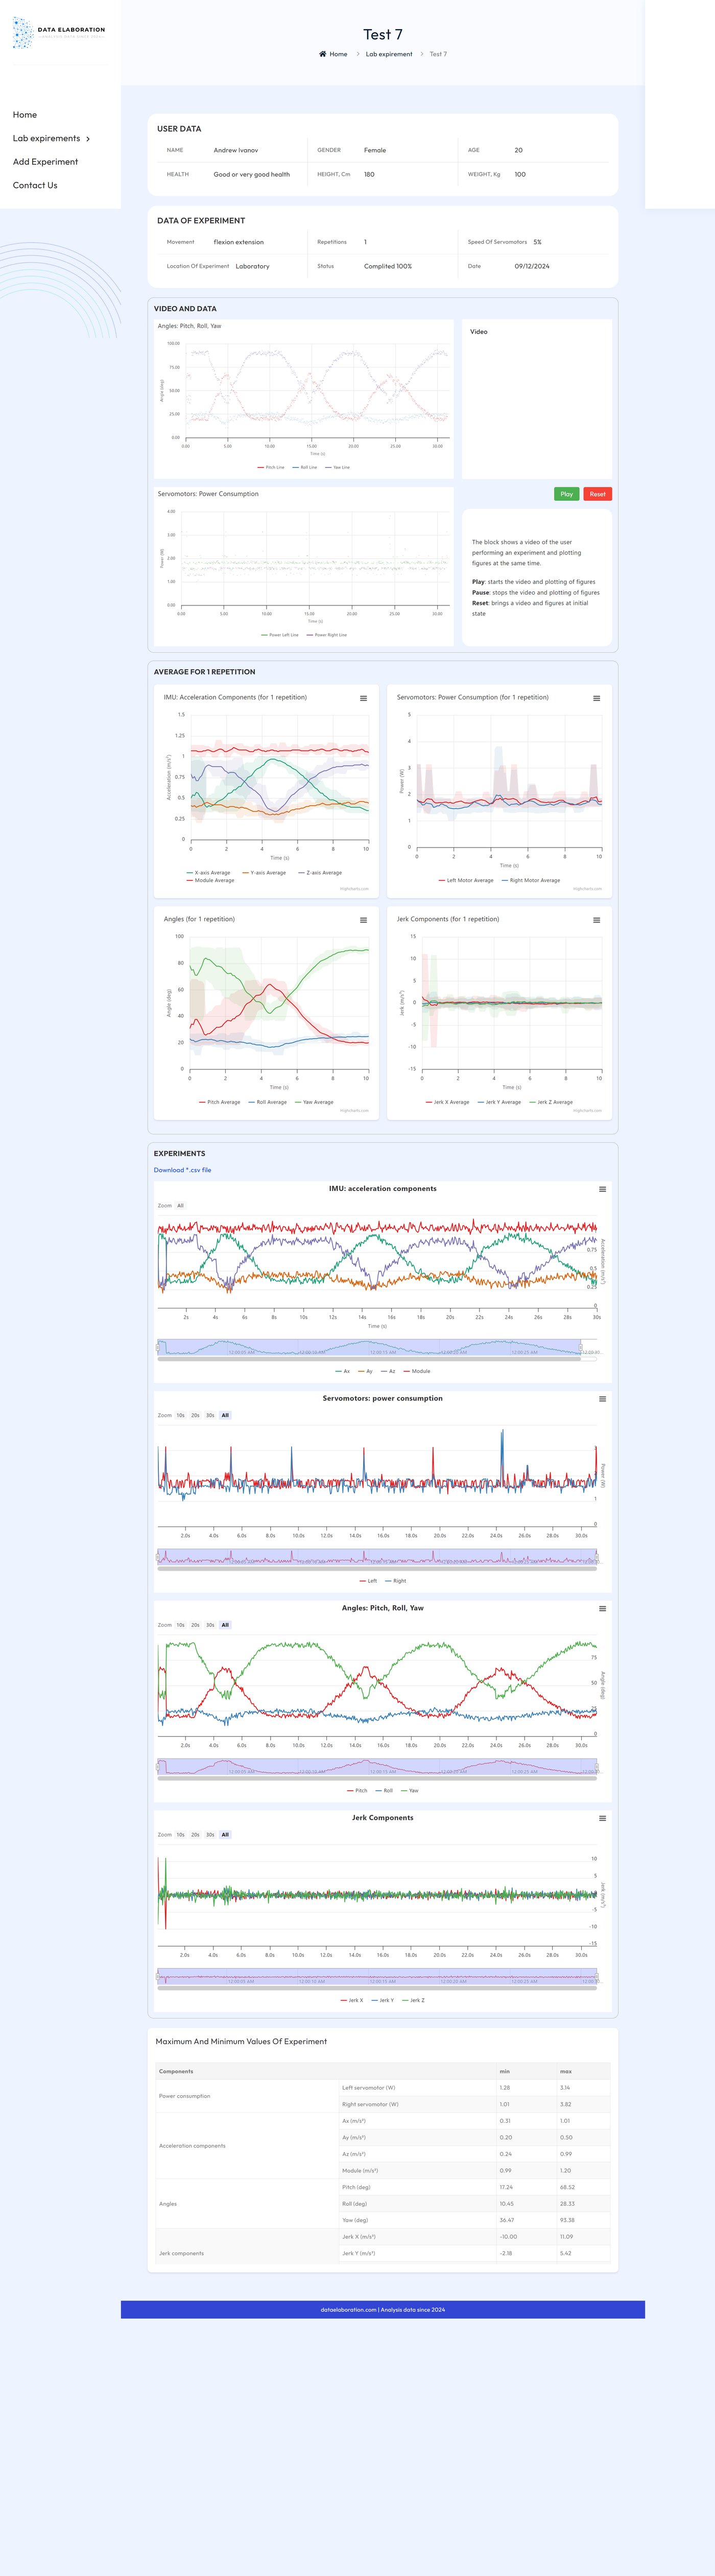
The key feature is syncing experiment video with the data charts, so you can watch the connection between the visible process and the measured values in real time.
Work done
- A data visualization system built on the Highcharts.js library
- Interactive charts with zooming and detailed views
- Syncing the video stream with the data shown on the chart
- A Vue.js app that drives the interactive chart
- Integrating the components into the WordPress CMS
- Responsive display across devices
- Performance tuning for large data sets
Tech stack
Visit the websiteResult
A working platform for visualizing scientific data that researchers actively use to analyze experiments. The system handles large volumes of data and gives convenient tools for interpreting it.
Interactive charts synced with video made data analysis much simpler and let researchers spot connections between visual events and the measured values.